Data Visualisation
Bring Conforma data to life with customisable dashboards and graphics

Bring Conforma data to life with customisable dashboards and graphics

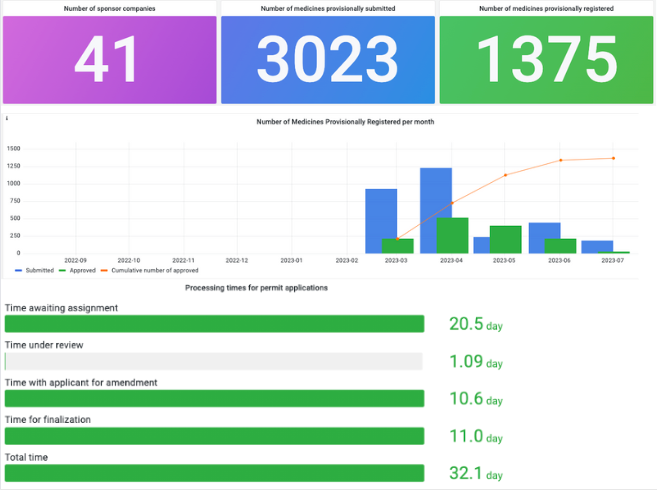
All data collected in Conforma can be visualised in a custom format, using the open source Grafana Dashboard.
Data from workflows and records can be used to monitor activity and performance levels, and to identify trends.
The great thing is – any data in Conforma can be visualised and built into a custom report, or we have a number of existing reports to use.
