Data Visualisation
We support multiple ways to view your data and use it for decision making.

We support multiple ways to view your data and use it for decision making.
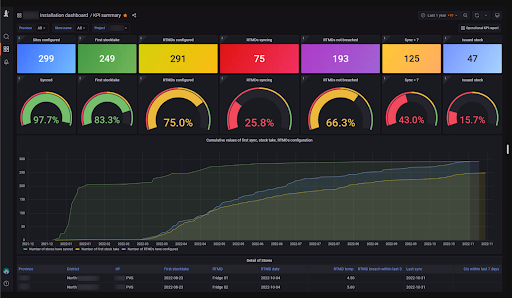
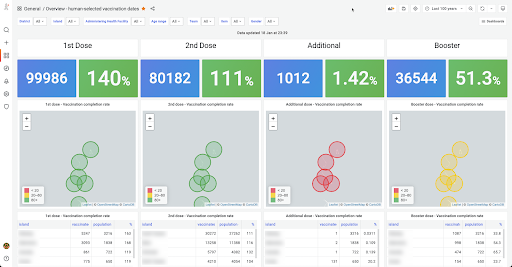
Open mSupply data from every facility is collected via the synchronisation system, so that data visualisation has access to all the data in mSupply. We use the open source Grafana Dashboard, but can also use Superset or Power BI (if you have a license).
Over the last 8 years we have built a large library of different dashboards that can be installed on your system with only minor tweaks. Here’s a sample: