This is the second in our series on how to implement effective Digital Health systems, and how to work out what effectiveness is.
The first part, “Effectiveness, or Oops! We failed Again” is available here.
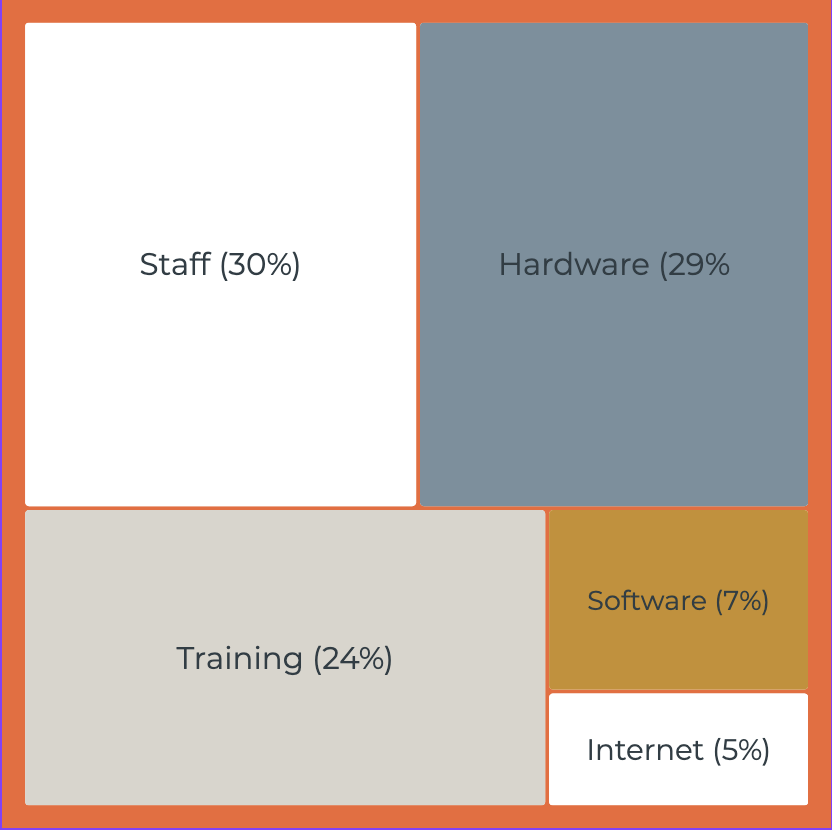
So many squares, so little meaning? We’ll get to the image above a bit further down the post.
Net what?
If you’re considering a new digital health system for your country, what’s the question you ask first?
How much will it cost?, right?
And usually, the person asking is thinking about the cost of the software. We want to (ever so respectfully) suggest it’s not the right question, and that “what will be the net outcome?” is a much better question.
“Net outcome” is the total benefits (often via cost savings, although improved health outcomes should also be counted), minus the additional costs of the intervention we’re measuring over the cost of the status quo.1
We’ve been working to install health supply chain systems in Low & Middle Income Countries (LMICs) for over 20 years now, and the number of times we’ve seen this done is… zero. That said, it’s not an easy thing to do – it’s hard to measure both costs and benefits well, and it involves lots of assumptions about a future that may or may not come to pass, and about the costs of the status quo (usually a paper-based system).
However, the way to end up doing it well is to start doing it as best we can, to learn lessons and iterate as we go.
Why not Benefit/Cost ratios?
A Benefit-Cost ratio (BCR) is the total of all the benefits of a project, divided by all the costs of a project. Projects with a BCR of less than 1 shouldn’t be done – they’ll cost more than the benefits they’ll give you.
BCRs are a good tool.
But Net Outcomes are often better- they tell us how much value will be created by the project.2
Let’s take this very simple example where the “benefit” is just the profit from selling some apples:
You want to sell 100 apples.
The Apples cost you $1 each (so $100 in total).
Market A is nearby – you only have $50 in transport costs, and you can sell the apples for $3 each ($300 total), so you’ll make $150 profit.
The BCR is 300/150 = 2
Market B is further away – you have to fly there (but the time you spend isn’t any greater than selling at Market A): $250 in transport costs, but you can sell the apples for $5 each ($500 total), so you’ll make $250 profit.
The BCR is 500/350 = 1.42
So the second option has a lower BCR, but all things being equal (there are no externalities from flying in our imaginary world, and you don’t have an alternative investment for the $200 extra for the fare), you’re going to spend the extra for the flight, and make $250 profit.
Moving on from selling apples to the more relevant question of “which digital health system should I choose?”, we should do the same thing.
Don’t choose the cheapest option.
If you can compare the benefit-cost ratios for different options, then good.
Even better is to also consider which option has the best net outcomes. Do that!
And that brings us to the graphic attached to this post. It’s a treemap showing the typical cost categories for running a Digital LMIS system.
When we ask “How much will it cost?” we’re usually only looking at the software – that’s only 7% of the total costs! Focusing on the software cost ignores both the other (much larger) costs, and also the benefits which can potentially be large.
In the next post we’ll start to look at Digital Public Goods, Open source software, and how this fits with our thinking about net outcomes.
1 Economists: we know we haven’t talked about NPV, discount rates, time value of money and the like – we’ll leave that to you, but this is a nod that these things matter.
2 If you’re wanting to maximise benefits for a given amount of investment, and multiple projects are available, then picking the interventions with the best BCR is the better approach.